Module 00: System Overview and Request Flow
Why this matters
Before you can debug a 502 Bad Gateway, tune a cache header, or reason
about why a request is slow, you need a physical, concrete picture of
what actually happens when someone types https://api.example.com/users
and hits Enter. Most people carry a vague cartoon in their head — "the
browser asks the server and the server answers" — and that cartoon is
where almost every misconception about latency, TLS, CORS, and caching
comes from. This module replaces the cartoon with an accurate mental
model you'll lean on for the entire rest of this track.
Here's the thing that surprises people: by the time your backend code
runs a single line, the request has already crossed a dozen distinct
systems — a DNS resolver, your home router, your ISP's network, several
internet backbone routers, a cloud provider's edge, a load balancer, and
possibly a reverse proxy — each of which can add latency, drop the
connection, rewrite headers, or reject the request outright. When you
later see a header you didn't set (X-Forwarded-For), a timeout you
didn't cause, or a request that never reached your code, you'll know
which box to look inside because you built the map here first.
This is the "how a request travels" module. We deliberately don't dig into the format of HTTP messages yet (that's module 01) — here we care about the journey: browser → DNS → network hops → the internet → a remote server in a cloud region → back again. Get the journey right and every protocol detail later has a place to hang.
Concepts
The request's journey, end to end
Type https://api.example.com/users and press Enter. Here is the whole
trip, in order, before your backend function runs:
The browser parses the URL. It splits it into scheme (
https), host (api.example.com), port (implied443for https), and path (/users). The host is a name — the network can't route to a name, only to a numeric IP address. So step 1's real output is: "I need the IP address forapi.example.com."DNS resolution turns the name into an IP. The browser asks a DNS resolver (usually your OS's configured resolver, often your router or a public one like
1.1.1.1or8.8.8.8): "what's the A/AAAA record forapi.example.com?" The answer comes back as something like93.184.216.34. This can involve several cached lookups or a full recursive walk (root →.com→example.com's nameservers). It's cached aggressively (see the TTL concept below).A TCP connection is opened to that IP on port 443. This is the three-way handshake: your machine sends
SYN, the server repliesSYN-ACK, your machine sendsACK. Now there's a reliable byte pipe between you and the server. This one round trip happens before any HTTP is sent.A TLS handshake secures the pipe (because it's
https). Keys are exchanged, the server proves its identity with a certificate, and an encrypted channel is established on top of the TCP connection. (Full details in module 09.) Only now can real HTTP flow safely.The browser sends an HTTP request — a small block of text (module
- — down the encrypted pipe: the method (
GET), the path (/users), and headers (Host,User-Agent,Accept, cookies…).
- — down the encrypted pipe: the method (
The packets traverse the internet. Your request doesn't teleport. It leaves your machine, goes to your router, to your ISP, hops across a series of backbone routers (each hop is one router forwarding the packet closer to the destination), possibly crosses an ocean via undersea cable, and arrives at the cloud provider's network edge (AWS, Azure, GCP…). Firewalls and NAT devices along the way may inspect or translate the traffic.
Inside the cloud, the request is routed to a backend server. It usually doesn't hit your application process directly. It typically lands on a load balancer (which picks one of N identical backend instances), often then a reverse proxy (nginx, Envoy) that terminates TLS and forwards a plain-HTTP request internally to your application server (e.g. a Uvicorn/Gunicorn process running your FastAPI app).
Your backend code finally runs. Your route handler for
/usersexecutes, maybe queries a database, and produces a response — a status code (200 OK), headers, and a body (e.g. JSON).The response travels all the way back along the same connection, through the proxy, the load balancer, back across the internet, into your browser, which parses it and hands the data to the page.
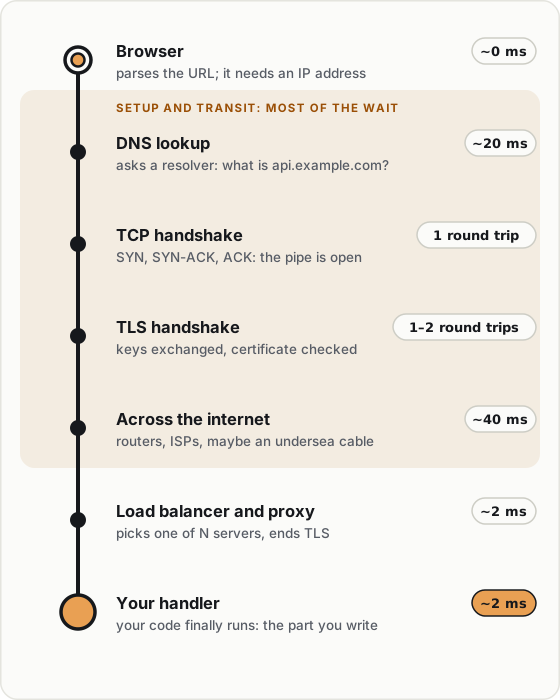
One request, end to end. The shaded part is setup and transit: most of the wait is over before your handler starts.
The same journey, drawn with where the milliseconds actually go — notice how little of the total is your handler:
  browser        DNS         TCP          TLS         internet      LB/proxy     your code
 (parse URL)   resolve     handshake    handshake      transit      dispatch     runs
     │            │            │            │             │            │            │
     ▼            ▼            ▼            ▼             ▼            ▼            ▼
 ┌───────┐   ┌────────┐   ┌────────┐   ┌────────┐   ┌─────────┐  ┌────────┐   ┌────────┐
 │  ~0ms │──►│ ~20ms  │──►│  1 RTT │──►│ 1-2 RTT│──►│  ~40ms  │─►│  ~2ms  │──►│  ~2ms  │
 └───────┘   └────────┘   └────────┘   └────────┘   └─────────┘  └────────┘   └────────┘
  step 1       step 2       step 3       step 4       step 6      step 7       step 8
                └──────── setup + transit: the bulk of the 250ms ───────┘      └─ handler ─┘
The reader who internalizes this list stops being surprised by latency ("why is my API 300ms even though my handler runs in 2ms?" — because steps 2-4 and 6 dominate) and stops being confused by "phantom" behavior ("the request never hit my logs" — it died at step 7's load balancer).
Client and server are roles, not machines
A client is whoever initiates a request. A server is whoever
listens and responds. Your browser is a client. But your backend,
when it calls a database or another API, is itself a client of that
service. The same physical machine can be a server for one connection and
a client for another, simultaneously. This is the same idea you met with
containers in learn/02-docker talking to each other — "who dials whom"
is what defines the roles, not the hardware.
   role: CLIENT              role: SERVER + CLIENT           role: SERVER
  ┌───────────┐   request   ┌──────────────────┐   request  ┌───────────┐
  │  browser  │ ──────────► │   your backend   │ ─────────► │  database │
  │           │ ◄────────── │ (serves browser, │ ◄───────── │           │
  └───────────┘   response  │  dials the DB)   │  response  └───────────┘
                            └──────────────────┘
   who initiates = client; who listens/answers = server (same box can be both)
The relationship is request/response: the client sends exactly one request and gets back exactly one response, per exchange. The server never speaks first on a plain HTTP connection — it only ever answers. (Server-initiated messaging needs WebSockets or Server-Sent Events, a later track's topic — and they still start with a client request.)
DNS: the internet's phone book (and its cache)
Names are for humans; the network routes on IP addresses. DNS is the
distributed lookup system that maps one to the other. The critical
practical fact for a backend engineer is caching via TTL
(time-to-live): every DNS record comes with a TTL in seconds saying "you
may cache this answer for this long." A record with TTL 300 means
resolvers will reuse the cached IP for 5 minutes before asking again.
This is why, when you change where api.example.com points, the change
doesn't take effect everywhere instantly — old IPs stay cached until
TTLs expire. You'll meet this exact TTL idea again in module 06 for HTTP
caching; it's the same "how long may I reuse this answer" concept.
The hops in between: routers, firewalls, NAT, proxies
Between your machine and the server sit many intermediaries:
- Routers forward packets one hop closer to the destination. A
request from your laptop to a US-East server might pass through 12-20
routers.
traceroute/tracertshows them. - Firewalls allow or block traffic by rule (e.g. "only allow inbound on ports 80 and 443"). A request to a port nothing listens on, or one a firewall blocks, simply never arrives — the client eventually times out. This is a very common "my server is up but I can't reach it" cause.
- NAT (Network Address Translation) lets many devices behind one
public IP share it — your home network's devices all appear to the
internet as your router's single public IP. This is why the server sees
your router's IP, not your laptop's private
192.168.x.x. - Load balancers and reverse proxies at the destination spread load
across many identical backends and often terminate TLS. They frequently
add headers so your backend still knows the real client — e.g.
X-Forwarded-For: <original client IP>andX-Forwarded-Proto: https. When you later wonder "why does my app think every request comes from10.0.0.5?", it's because that's the load balancer's IP and the real client IP is inX-Forwarded-For.
Where "the backend server" actually lives
When we say the request is "routed to a remote backend server, e.g. on AWS or Azure," here's the concrete stack it typically lands on inside a cloud region:
Internet
   │
   ▼
[ Cloud region edge / public IP ]
   │
   ▼
[ Load balancer ]      ← picks one healthy backend instance
   │
   ▼
[ Reverse proxy: nginx / Envoy ]   ← terminates TLS, may cache/route
   │  (plain HTTP over the internal network)
   ▼
[ App server: Uvicorn/Gunicorn ]   ← runs your Python/FastAPI process
   │
   ▼
[ Your route handler ]  → maybe a database, cache, other services
Every layer here is a place a request can be delayed, rejected, or
rewritten — and a place you'll learn to inspect. In learn/03-kubernetes
you saw the in-cluster version of this: a Service load-balancing across
Pods, an Ingress as the reverse proxy. Same shape, different words.
What the response is (a preview)
The server's answer is not "the data." It's a structured message: a
status line (HTTP/1.1 200 OK), a set of headers (metadata like
Content-Type: application/json, Content-Length: 1523), a blank line,
and then the body (the actual JSON/HTML/bytes). The status code is the
server's one-glance summary — 2xx success, 3xx redirect, 4xx "you
messed up," 5xx "I messed up." Modules 01 and 05 make this precise;
for now, just hold the shape: status + headers + body, mirroring the
request's method/path + headers + body.
Command reference
Real commands to observe each stage of the journey yourself. (This module is about the journey, so these are diagnostic commands, not HTTP message internals — those start in module 01.)
| Command | What it shows you | Which journey step |
|---|---|---|
nslookup api.example.com |
The IP a name resolves to | Step 2 (DNS) |
dig api.example.com |
DNS answer with TTL and record details | Step 2 (DNS) |
dig +trace api.example.com |
The full recursive walk root → TLD → authoritative | Step 2 (DNS) |
tracert example.com (Win) / traceroute (Linux/macOS) |
Every router hop between you and the host | Step 6 (network hops) |
ping example.com |
Round-trip time to the host; reachability | Steps 3/6 (reachability, latency) |
curl -v https://example.com/ |
The whole exchange verbosely: DNS, TCP, TLS, request, response | Steps 2-9 |
curl -w '...' -o /dev/null -s URL |
A timing breakdown of each phase | Steps 2-6 (latency attribution) |
python -c "import socket; print(socket.gethostbyname('example.com'))" |
Resolve a name to an IP from Python | Step 2 (DNS) |
Breakdown of the key options:
dig api.example.com— the answer section shows a line likeapi.example.com. 300 IN A 93.184.216.34. That300is the TTL in seconds.dig +short api.example.comprints just the IP.tracert/traceroute— each numbered line is one router hop, with the round-trip time to that hop. Increasing hop numbers = getting physically/topologically farther. A row of* * *means a hop that won't answer probes (common; not necessarily a problem).curl -v— the-v(verbose) flag prints, with prefixes:*lines = curl's own notes (DNS, "Trying...", TLS handshake, cert info); >lines = the request curl sent;<lines = the response the server sent. This single command lets you see steps 2 through 9.curl -w— the write-out flag substitutes timing variables. We use it in exercise 4 to attribute latency to DNS vs. connect vs. TLS vs. the server itself.
Hands-on exercises
You don't need a backend of your own yet — the internet is your test
subject. A couple of exercises stand up a trivial local server so you can
watch a request arrive. Use example.com (a real IANA-reserved domain
meant exactly for this) as a safe target.
1. Watch the whole journey with one command
curl -v https://example.com/ 2>&1 | head -40
Read the output slowly and label each part:
* Host example.com:443 was resolved.and* Trying 93.184.216.34:443...→ DNS (step 2) and TCP connect (step 3).* TLSv1.3 (OUT), TLS handshakelines and* Server certificate:→ TLS handshake (step 4).- Lines starting with
>(e.g.> GET / HTTP/2and> Host: example.com) → the request you sent (step 5). - Lines starting with
<(e.g.< HTTP/2 200and< content-type: text/html) → the response (steps 8-9).
Expected: you can point at a line for every one of steps 2-9.
2. Resolve the name yourself and see the TTL
dig +noall +answer example.com
Expected output (IP and TTL will vary):
example.com. 278 IN A 93.184.215.14
That middle number is the TTL in seconds — how long resolvers may cache
this. Run it again a few seconds later and watch the number decrease
(it's counting down within a shared cache), then jump back up after it
expires and is re-fetched. Now try dig +short example.com for just the
IP, and python -c "import socket; print(socket.gethostbyname('example.com'))"
to get the same answer from code.
3. Count the hops
tracert example.com        # Windows
# or: traceroute example.com   (Linux/macOS)
Expected: a numbered list of router hops with round-trip times, ending at
(or near) example.com. Count them. Note how the times generally climb
as hop numbers increase. Rows of * * * are hops that don't reply to
probes — normal.
4. Attribute the latency
Create a file curl-timing.txt:
    dns_lookup:  %{time_namelookup}s
    tcp_connect: %{time_connect}s
    tls_done:    %{time_appconnect}s
    ttfb:        %{time_starttransfer}s
    total:       %{time_total}s
Then:
curl -w "@curl-timing.txt" -o /dev/null -s https://example.com/
Expected: cumulative timings, e.g. DNS at 0.03s, TCP connect at 0.08s,
TLS done at 0.15s, first byte (ttfb) at 0.20s. Notice how much of the
total is spent before the server even starts sending — that's steps
2-4 and 6, not your (hypothetical) backend code. This is the reason
"my handler is fast but the API feels slow" is usually a network/setup
story, not a code story.
5. Stand up a real server and watch a request arrive
In one terminal, start Python's built-in server (it logs each request):
python -m http.server 8000
In a second terminal:
curl -v http://localhost:8000/
Expected: the first terminal prints an access-log line like
127.0.0.1 - - [26/Jul/2026 10:00:00] "GET / HTTP/1.1" 200 -. That line
is step 8 — proof the request reached and ran on the server. Note the
target was localhost: no DNS-over-the-internet, no TLS (http), so the
journey collapses to steps 3, 5, 8, 9 only. Compare its curl -v output
to exercise 1's — far fewer * lines because most stages are skipped.
6. See the client/server roles flip
Keep python -m http.server 8000 running. Now write a tiny Python client
that is itself a client of that server:
# client.py
import http.client
conn = http.client.HTTPConnection("localhost", 8000)
conn.request("GET", "/")
resp = conn.getresponse()
print(resp.status, resp.reason)          # 200 OK
print(resp.getheader("Content-Type"))     # text/html; charset=utf-8
conn.close()
python client.py
Expected: 200 OK printed by your code, and another access-log line in
the server terminal. Your Python process was the client here — the
same role the browser played in exercise 1.
7. Diagnose and fix: the request that never arrives
Start the server on port 8000 again (python -m http.server 8000), then
run this broken command and diagnose why it fails:
curl -v --max-time 5 http://localhost:9000/
Expected: it hangs, then fails with something like
Failed to connect to localhost port 9000 ... Connection refused (or a
timeout). Diagnose: the server is listening on 8000, but you
asked for 9000 — nothing is listening there, so the TCP connect (step
3) fails and no HTTP is ever sent. This is the everyday "server is up but
I can't reach it" bug in miniature (here it's a wrong port; in production
it's often a firewall/security-group rule blocking the port).
Fix: point at the right port:
curl -v --max-time 5 http://localhost:8000/
Expected: 200 OK and a new access-log line on the server. Lesson: when a
request "never arrives," suspect step 3 first — wrong host, wrong port, or
a firewall — before you suspect your application code.
8. Prove DNS caching is real
dig +noall +answer example.com          # note the TTL, e.g. 260
# wait ~5 seconds
dig +noall +answer example.com          # TTL is now lower, e.g. 255
Expected: the second TTL is lower than the first — you're reading the same cached record, counting down. This is exactly the "how long may I reuse this answer" mechanic you'll reuse for HTTP caching in module 06.
Independent challenge
No commands given — work it out from this module.
Task: Pick any real public website you use (not example.com).
Produce a single written "journey report" for loading its homepage that
answers, with evidence you gathered yourself: (a) what IP(s) its hostname
resolves to and what the DNS TTL is; (b) roughly how many network hops
away it is from you and the round-trip time to the last hop; (c) how much
of the total request time is spent in DNS + TCP + TLS setup versus waiting
for the server's first byte; and (d) whether there's any sign it sits
behind a load balancer or CDN (hint: re-resolve the name a few times, or
from different tools, and see whether the IP changes). Tie each finding
back to the numbered journey step it corresponds to. This uses the same
tools from this module's command reference — the challenge is assembling
them into one coherent picture and interpreting it, not running them.
Hint
For (d), a hostname that resolves to different IPs on repeated dig
calls, or to many IPs at once, is a strong sign of a load balancer or CDN
(step 7) fronting many servers behind one name. Compare the
time_appconnect and time_starttransfer values from exercise 4's
curl -w technique to separate "setup" cost from "server thinking" cost.
Common mistakes & troubleshooting
- Thinking latency = your code's runtime. Steps 2-4 and 6 (DNS, TCP, TLS, network transit) often dwarf handler execution. Always attribute latency to a phase before blaming code.
- Assuming a request that isn't in your logs never left the client.
It may have died at a firewall, load balancer, or reverse proxy (step
- before reaching your app. Check the intermediaries' logs too.
- Confusing "server is running" with "server is reachable." A running
process on the wrong port, behind a closed firewall, or bound only to
127.0.0.1(not0.0.0.0) is up but unreachable from outside. - Forgetting DNS is cached. Changing where a name points is not instant globally; old IPs live until TTLs expire. "It works on my machine but not the server" is sometimes a stale-DNS story.
- Trusting the source IP your app sees. Behind a proxy/load balancer,
the immediate peer IP is the proxy's; the real client is in
X-Forwarded-For. Logging the wrong one misleads every later investigation. - Believing the server can "push" first. On plain HTTP the server only ever responds to a request. If you need server-initiated messages, that's a different mechanism (WebSockets/SSE), covered in a later track.
Checkpoint quiz
Write down your answer to each question before expanding it — checking without attempting first is the single easiest way to fool yourself into thinking you've learned this.
- Put these in the order they happen for
https://api.example.com/users: TLS handshake, DNS resolution, TCP handshake, your route handler runs, HTTP request sent. - What defines whether a given machine is acting as a "client" or a "server" for a particular connection?
- Your handler runs in 2ms but the browser reports 250ms for the request. Name three phases of the journey that could account for the other ~248ms.
- You changed which IP
api.example.compoints to an hour ago, but some users still hit the old server. What mechanism explains this, and what controls how long it lasts? - Your app logs show every request coming from
10.0.0.5, but real users are all over the world. What's going on, and where is the real client IP? - A request to your server "never arrives" — nothing shows in the app logs. List three distinct places/causes along the journey that could swallow it before it reaches your code.
Answers
- DNS resolution → TCP handshake → TLS handshake → HTTP request sent → your route handler runs. (Name resolves to IP, then a connection is opened, then secured, then the request flows, then your code runs.)
- The role is defined by who initiates the connection/request: the initiator is the client, the listener/responder is the server. The same machine can be both, for different connections, at the same time.
- Any three of: DNS resolution, TCP handshake round trip, TLS handshake, network transit time across many router hops (step 6), plus time in intermediaries (load balancer/proxy). The point: most of it is setup and transit, not handler execution.
- DNS caching: resolvers cache the old record until its TTL expires. The record's TTL (in seconds) controls how long the stale answer can linger.
- Your app is behind a load balancer / reverse proxy, so the immediate
peer it sees is the proxy's IP (
10.0.0.5). The real client IP is in theX-Forwarded-Forheader the proxy added. - Any three of: a firewall/security group blocking the port; the wrong host/port so TCP connect fails (nothing listening); a load balancer with no healthy backends or a failing health check; a reverse proxy rejecting or misrouting it; TLS failure before any HTTP is exchanged.
Further reading & sources
- MDN: What is a URL? - breaks down the scheme/host/port/path the browser parses in step 1.
- MDN: How the web works - a beginner-level narration of the same client → DNS → server journey.
- Cloudflare: What is DNS? - clear explanation of recursive resolution and TTL caching from step 2.
- Cloudflare: What is a load balancer? - the step-7 load balancer and reverse-proxy layer explained.
- MDN: X-Forwarded-For - why your app sees the proxy IP and where the real client IP hides.
- High Performance Browser Networking (free book) - Ilya Grigorik's deep dive into TCP, TLS, and latency that underpins this whole module.
Next
01-http-protocol-basics — now that you have the journey in your head, we zoom into step 5 and 8: what an HTTP request and response actually look like as raw text on the wire.