# Lesson 09: Throughput and Little's Law
## Roadmap
You are in **System Design Interview Prep**, Track 01, **Core Fundamentals**: lesson 9 of 19 (how much work, how fast, and how many at once). It builds on [Lesson 08: Latency](../08-latency/README.md). Next comes [Lesson 10: Availability](../10-availability/README.md).
These are the written notes for the lesson's video. Prefer paper? The same notes are a free, printable PDF: [download SD-A-009.pdf](https://backendroadmap.com/notes/system-design/SD-A-009.pdf).
## Concept
> [!key] Throughput is work done per second; Little's Law ties it to latency (in flight = throughput × latency), and queues make latency explode as a system nears 100% busy.
## Explanation
### Latency and throughput are different questions
Picture a highway. **Latency** is how long one car takes to make the trip. **Throughput** is how many cars get through per hour. A road can be fast for each car but carry few of them, if it has only one lane.
Throughput is work completed per unit of time, in the unit each part speaks: **RPS** (requests per second) for APIs and load balancers, **QPS** (queries per second) for databases and caches, **MB/s** or **Gbps** for networks and disks, **messages/s** for queues and streams.
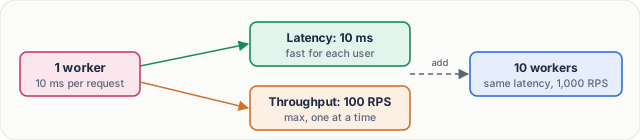
*Figure 1. One worker at 10 ms per request can never serve more than 100 requests per second; more workers raise throughput, not latency.*
### Little's Law: the link between them
The bridge between throughput and latency is **concurrency**: how many requests are in flight at the same moment. Little's Law says that, for any stable system:
L = λ × W · in flight = throughput × latency
It holds for any system that is not piling up work without limit: a web server, a database connection pool, a checkout line, a Kafka consumer group. It is the fastest way to size anything that holds requests at once: worker threads, connection pools, queue capacity.

*Figure 2. 5,000 requests arrive per second and each stays 50 ms, so about 250 are inside the system at any instant.*
> [!example] **Worked example.** An API handles **5,000 RPS** and each request takes **50 ms** (0.05 s). In flight: 5,000 × 0.05 = **250**. Your workers, threads and database pool together must hold at least 250 concurrent requests, plus headroom.
> Now the database slows down and latency doubles to 100 ms. At the same traffic, in-flight requests double to **500**. A pool sized for 250 runs dry, new requests wait for a connection, latency rises further, and a small slowdown becomes an outage.
> Same rule, a database pool: 2,000 queries/s at 20 ms each needs about 2,000 × 0.02 = **40** connections.
### Saturation: throughput hits a ceiling
As load rises, throughput first rises with it. Every system has a capacity, set by its slowest resource (CPU, disk, a lock, a pool). Past that point throughput stays flat: extra requests cannot be served faster, so they wait in a queue. And waiting is where latency goes.
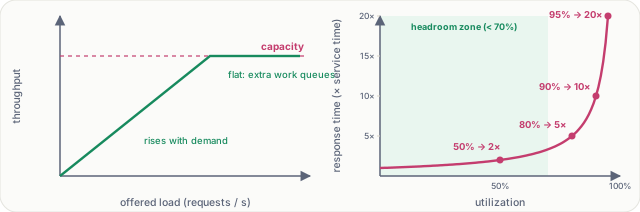
*Figure 3. Left: throughput flattens at capacity. Right: response time in a simple queue grows like 1 / (1 − utilization), so it explodes near 100% (at 99% it reaches 100×, off this chart).*
That is why teams run servers at 50–70% at peak, autoscale before 80%, and alert well before 100%. The last 20% of capacity costs most of your latency.
### How to raise throughput
- **Find the bottleneck first.** Measure which resource saturates (CPU, I/O, a lock, a pool). Scaling anything else just moves the queue.
- **Scale out.** Add parallel workers or servers behind a load balancer (needs stateless services).
- **Batch.** Group small operations: one insert of 500 rows beats 500 inserts; one network call for 50 keys beats 50 calls.
- **Async, non-blocking I/O.** Workers serve other requests while waiting on the network or disk, instead of sitting idle.
- **Load test.** Find the highest throughput you can sustain *while still meeting your p99 latency target*. That number, not the peak, is your capacity.
- **Mind the trade-off.** Batching and big queues raise throughput but add waiting time: protect p99 for user-facing APIs, maximise throughput for batch jobs.
## Key terms
| Term | Meaning |
|---|---|
| **Throughput** | work completed per second (RPS, QPS, MB/s) |
| **Latency** | time for one request |
| **Concurrency** | requests in flight at once |
| **Little's Law** | L = λ × W |
| **Utilization** | share of time a resource is busy |
| **Saturation** | load beyond capacity; work queues |
## Interview questions
Each question is tagged by kind: **Basic** (definitions), **Scenario** (apply it to a system) and **Tricky** (the follow-ups interviewers use to go deeper). Answer out loud before you open the answer.
> [!interview] What is Little's Law, and how do you use it? (Basic)
What a strong answer covers
In flight = throughput × latency (L = λW). Use it to size anything that holds requests at once. 5,000 RPS at 50 ms means about 250 requests in flight, so workers, threads and pools need room for 250 plus headroom.
What a strong answer covers
Yes. One worker that answers in 10 ms is fast for each user but can never exceed 100 requests per second. Latency is time per request; throughput is requests per second; concurrency links them.
What a strong answer covers
Requests start queueing. In a simple queue model, response time grows like 1 / (1 − utilization): about 2× at 50%, 10× at 90% and 100× at 99%.
What a strong answer covers
In-flight requests rise from 2,000 × 0.04 = 80 to 2,000 × 0.2 = 400. Pools sized for ~100 run out, requests wait, latency climbs further and errors follow. Roll back, then find the slow dependency.
What a strong answer covers
3,000 × 0.015 = 45 connections on average. Add headroom for bursts (about 1.5–2×, so 70–90) and check the total across all app instances against the database's connection limit: 10 instances × 9 connections each, not 10 × 90.
What a strong answer covers
Find the bottleneck first, then fix that resource: scale out, batch, async I/O, cache. Confirm with a load test at the p99 target.
What a strong answer covers
Queueing: at 95%, latency is about 20× the service time. Failures: with three servers at 70%, losing one pushes the other two to about 105%; at 95%, one failure means overload.
What a strong answer covers
Little's Law uses the mean, which gives average concurrency. But the slow tail holds connections 40× longer, so add headroom and set timeouts so slow requests can't drain the pool.